Blog Insights
Rebuilding a Complex Digital Ecosystem
Your organization’s digital presence may have started off as a simple platform, but as your digital footprint grows, so too does your digital ecosystem. The key to managing your various properties is to ensure that you are being deliberate in how they are connected, branded and communicated.
The fish surfaces to grab a stray insect. An osprey grabs the fish for its chicks. The chicks deposit their waste into the marsh, nourishing plants. The plants attract insects, and so on. All is balanced, all form a part in a powerful, beautiful whole: an ecosystem.
Like a natural area, organizations have their own digital ecosystems: webs of internal and external properties that need to work together to convey key messages, provide critical services, spread valuable information, and engage target audiences. No raptors swoop for prey in these digital ecosystems, but, done right, they have their own beauty.
Over the past few years, I have had the pleasure of working with a large, well-established federal government program, the US Department of Education’s National Assessment for Educational Progress (NAEP). Like many large and established organizations, NAEP had a digital presence spread across multiple, somewhat distinct websites. What had begun as one site had grown, over time and through no specific group’s fault, into a somewhat disjointed whole that lacked harmony. This post is the story of returning the program’s digital ecosystem to efficiency.
Understanding the existing state of your ecosystem
The diagram below shows NAEP’s digital presence when we began the process of realigning the program’s various properties. Each box was a separate property, with its own special features and particular audiences, and with only general branding tying it to the others.
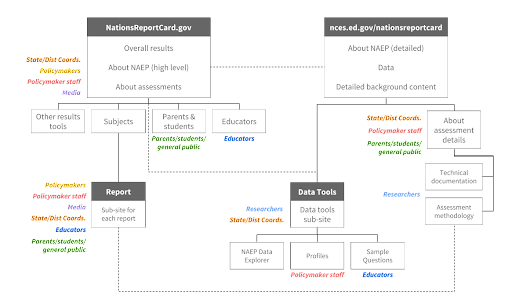
There were many disparate elements in play. While ideally there would be complementary pieces woven together in a clear whole, the situation was one of disparate touchpoints with infrequent and unclear connections. For example, policy staff needed to navigate across two to four different digital properties to find the breadth of information required to accomplish key tasks. The user experience changed markedly across each property, and it was easy to lose orientation. Active social media helped, but could only do so much to connect that which felt distinct. The NAEP properties were more akin to an overbuilt, road-heavy suburb than to a placid, forested lake.
The path to harmony: research and analysis
So what have we done to return this digital ecosystem to harmony? Step one was the diagram above: a clear inventory of all properties and services. Once we had a complete picture of all digital properties, we were then able to focus on the goals of each:
- What content and/or functionality is on each property?
- Which audience is each piece of content or each tool targeting?
- To what extent does the user experience of each property or service tie together? Are there clear, sensible paths to the other related properties?
- Based on analytics data, what content is getting used and which seems to be stagnant?
We also learned what we could about NAEP’s audiences:
- What needs do members of each audience have with education data? Which tasks are they completing when they use this information?
- How do audience members use education data today?
- How does or could NAEP’s content contribute to success at achieving these tasks?
- In what formats do audiences want data and related information?
- What are audiences’ dispositions towards NAEP and what it provides to them?
Finally, we needed to look at the existing audience pathways, which we did through a great deal of usability testing and analytics analysis. We were analyzing:
- At major touch-points, is there adequate content to draw in each target audience?
- Once drawn in, can an audience member find additional related content?
- Where paths do exist, are there jarring changes in user experience that disrupt the perception of it being a single organization or which put audiences at risk of losing their way?
What we found: In short, NAEP’s content is unique enough that there is always a draw for some audiences. As we suspected, though, the needs for many audiences spanned different parts of the ecosystem and different experiences in it, creating big disconnects. Pathways between parts existed, but they were not always clear and logical. Complementary information existed, but it was not set up to actually be complementary. Opportunity abounded.
Building the solution
With the diagnosis and research completed, our team was able to seek solutions. Job one was reworking the information architecture of the entire NAEP ecosystem. We grouped all reports and data tools (i.e., all results) into the established NationsReportCard.gov site. As the NAEP team wanted to maintain the existing organizational site, we determined that it should hold informational content, background documentation, and materials for specialized audiences. This new structure now places content commonly needed by different target audiences in logical clusters, better-enabling access to complementary content and features.
The subsequent effort went into creating dedicated paths between products at key jumping off points. For example, featured links to the “State Profiles” product from state pages of assessment reports allow the important state coordinator and state policymaker audiences to journey seamlessly to many different views of state data from a common, overview-level starting point. We also better-defined reports to be more task and audience focused, introducing better layering of content for levels of depth desired. The diagram below shows these information architecture improvements.
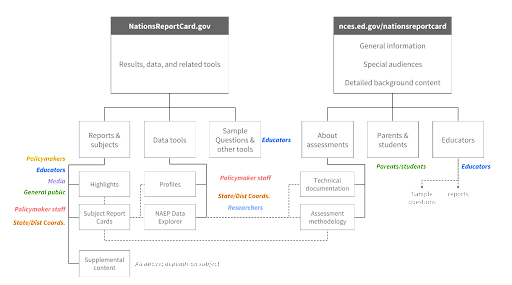
While additional elements have been added, they are now more helpfully clustered and connected, so that audiences can easily work from one needed product to another. There are also now only two different sites overall, resulting in a more unified experience.
A key to that unified experience — a unified visual design — was, happily already underway as we completed the other work above. Having also undergone a recent visual identity update, NAEP had new standards for typography and color usage which allowed us to develop a robust and connected design strategy in our areas of focus that gained broad traction across owners of different properties. This strategy included not only which elements of the color palette to use, but, more importantly, what visual language we wanted in place. For example, we selected one of the primary brand colors an “action color,” used for all links, buttons, and other places where users could engage in an action. We selected another color to indicate selection or focus.
These choices now ensure that the digital properties for the organization as a whole won’t just look similar, but they will act in common ways. This supports a true common user experience structure for the entire digital ecosystem.
Next steps
We continue to refine the changes we have made through ongoing research, testing, analytics review, and collaboration. One area in which I’d like to see us make more progress is a content strategy; we work among a great set of partners with all kinds of expertise, and we have made progress here, but planning and coordination can still be better to ensure content supports and promotes the elements of the NAEP digital ecosystem.
Looking ahead, some specifics areas I’d like to see us optimize include:
- Creating a more robust, shared editorial calendar to help coordinate web and social media content;
- Designing and producing specialized content (e.g., blog posts) to focus on narrow, but important, findings between major report releases;
- Developing more unified messaging for the entire NAEP ecosystem and update key content and design elements to reflect that messaging;
- Continuing to push audience-facing plain-language writing as much as possible with the technical subject matter;
- Continuing to consider ways to create pathways between related NAEP products; and,
- More deeply leveraging analytics to see how well the properties are tied together and whether there are still opportunities to update old content and clarify audience paths based on known touchpoints.
Our end goal is to see a healthy physical ecosystem with complementary roles between different elements, a balance of power and focus, and highly-targeted specialization. Key content and functionality should live as distinct applications, but with a clear relation to a larger whole. Content in one place will do its own job, but will point to other content that adds additional value or builds the audience relationship. Material designed to pull audiences in will be well targeted to different audiences, maximizing a particular touchpoint. Tying these elements together unifies messaging and branding. This structure represents the same virtuous loops that we see in healthy natural places.
Takeaways
Many complex digital projects have ecosystem characteristics. UX practitioners confronting larger projects should consider how the concepts we have shared apply to their work. If you are taking on your own digital ecosystem project, I suggest the following essential steps:
- Diagram all of the organization’s existing (and potential) digital properties and map out actual interrelationships. What user flows exist between them? What deliberate or informal paths do audiences currently have to engage with all you have to offer? This is a map of the terrain and features of an actual ecosystem.
- Nail down your goals and audiences (which hopefully exist already!) and document them in a way that can guide the team. Which audiences are the most important? Which tasks do they want to do, and which do you want them to do? Are there important ways different audiences need to interact? (In the physical world analogy, these are the species.)
- Determine how the current properties and paths between them support audience tasks. Do key flows maintain the right context throughout, or do they hop in awkward ways? Are needs readily filled? Are audience interactions supported in clear, consistent ways? (In the nature context, this would be the step where one identifies pollutants, invasive species, encroaching development, and so on.)
- Tune your process to ensure all team members can get aligned and stay there. Look for incentives that promote unhelpful siloing and rework them.
- Make sure there is an overall champion to push this structure and the vision.