Blog Insights
Create Order from Chaos: Drupal Taxonomy with D3.js, AngularJS & Elasticsearch
Well, you can easily translate this content into statistical and visual data elements in Drupal! Earlier this year, we did just that by exposing some data in the form of aggregations on the Global Innovation Exchange (GIE) on the site’s data page. Site users can generate new content and tag it through an assortment of taxonomy fields (i.e. Sector, Region, Country, etc). Along with the many SQL and Views-powered text lists and stand alone counts throughout the page are some pretty neat visualization charts (i.e. bar graphs). These display different data types that are aggregated by a “select.”
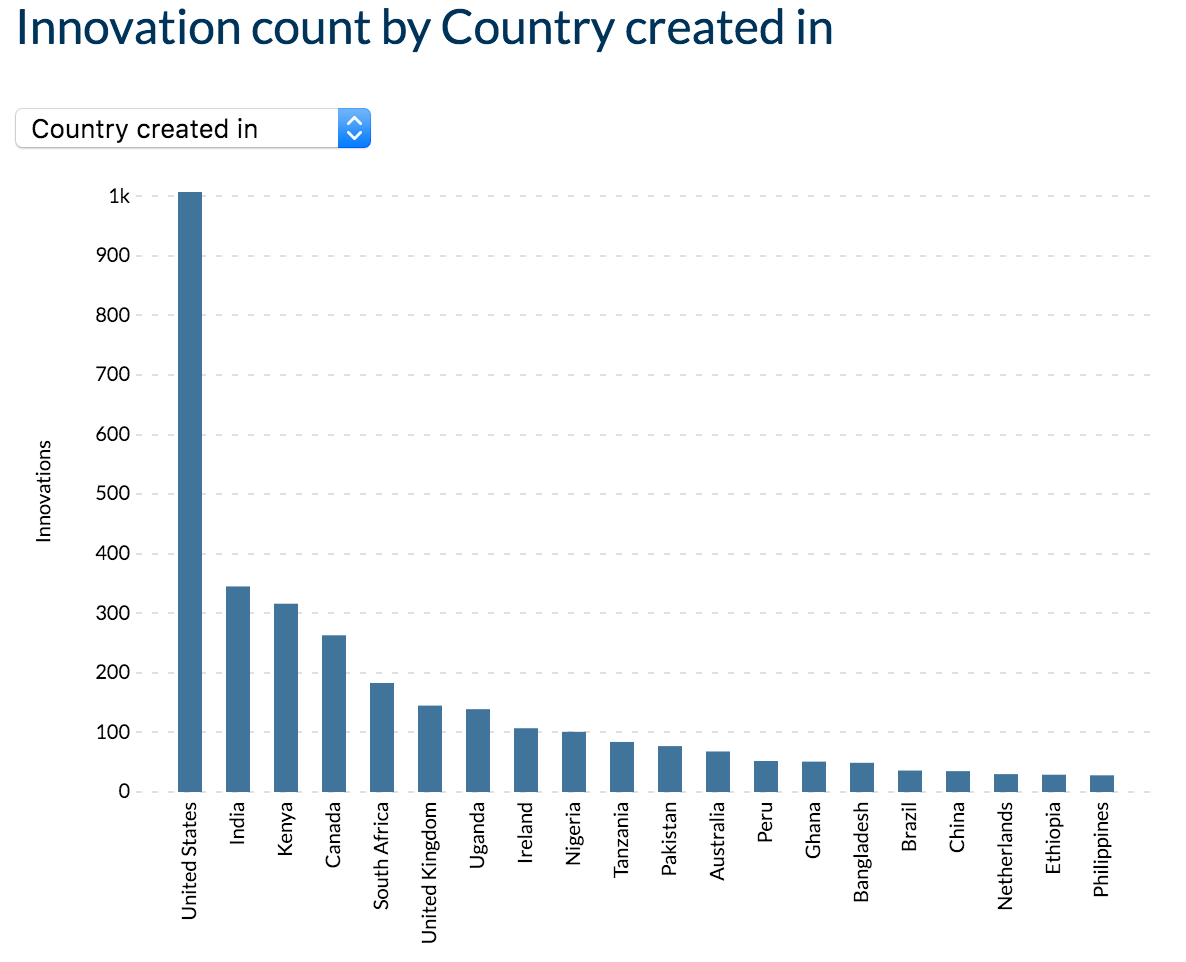
Changing the select updates the data being displayed, the y-axis scaling, and the amount of bars—all with smooth transitions. Neat, right?! For these, we used a fun combination of tools on top of the Drupal 7 site: D3.js, AngularJS, and Elasticsearch. We’ll take a brief look under the hood to see how these tools interact.
For starters, all the data being shown is already in our site as Drupal nodes. Through Search API, we indexed the appropriate data to an Elasticsearch index. We went with Elasticsearch to make use of its aggregation system. Through it, we can easily and quickly come up with simple and complex aggregation queries for sums and counts all within the API call. These will return our data as aggregated buckets using the entity ID as a key. No need for additional handling such as Views to aggregate things. For example, if we aggregate on a taxonomy term reference field, we get the following:
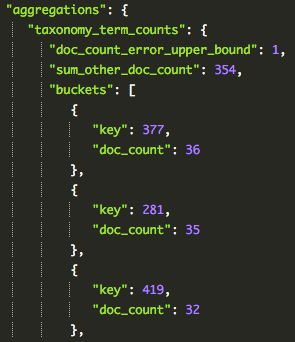
We can see the keys are the ID of the taxonomy term with “doc_count” being the amount of times the term was used throughout all nodes.
With AngularJS, we can set up the base for our graphs: the title, select, and SVG chart area. This is about as basic as as AngularJS goes. Using the AngularJS Elasticsearch module, we can create a service factory which can query the index in an Elasticsearch-friendly way. Using the returned information, we properly format the data for our charts to use. Changing the select updates the aggregation we want, thus selecting the Elasticsearch query we want to use.
Now that we have the formatted data, the bar chart can be created! The D3.js site has been a great resource for inspiration for what can be done with the magic of D3. We have an Angular listener in our app for the select, which tells the chart, “Hey! The data has changed; use this set instead.”
The chart goes through the D3.js process of either entering new data bars, updating existing data bars, or exiting unused data, which is removing the data from the chart. [Note: You can learn much about creating charts and D3’s enter, update, and exit functions from Mike Bostock’s great tutorial.] The x-axis labels and y-axis scale also get updated based on the data fed to it from AngularJS. This can all be seen below.
As far as the Drupal side goes, the custom module simply creates a block for the AngularJS app to effectively take over and also adds all of the necessary JS libraries and code involved. There is also some code to apply the ng-app to the current page the user is on via the Drupal AngularJS module.
And that’s it! The Elasticsearch aggregation system, while a little goofy to get used to, is very powerful with what it can do. AngularJS provides us with a way to create multiple elements—charts in our case—of the same type in an easy way. D3.js, of course, is an awesome tool for creating dynamic charts. Creating charts and graphs to visualize any kind of data has always been a great way to spread a message to your audience. There are many great ways to do this with all kinds of Drupal data beyond taxonomy, and this is just one combination to do so.
Questions on how this was implemented? Did you do something similar on a Drupal site in a different way? Feel free to contact me today!