Blog Insights
Getting Started with Google’s Core Web Vitals
In May of 2020, Google announced updates to their Core Web Vitals—a set of metrics that measure web usability based on load time, interactivity, and the stability of content as it loads. Broadly, these metrics are designed to help Google measure user experience on the web. A Google study of millions of site visits found that “when a site meets the recommended thresholds for the Core Web Vitals metrics, users are at least 24% less likely to abandon a page before it finishes loading.” Given that 90% of internet searches worldwide are conducted using Google, Google plays a vital role in discovery and traffic.
How it works
When Google sends a visitor to a website, they record usability metrics and rate sites based on their average scores over the previous 28 days. Google has announced that starting in summer 2021, these metrics will impact search rankings. You can view these scores for any website using the PageSpeed Insights tool. Google will begin using page experience as part of its ranking systems beginning in mid-June 2021. However, page experience won’t play its full role as part of those systems until the end of August.
Getting started
To check your website, you can use PageSpeed Insights to check any single page, even one you don’t own. PageSpeed Insights allows you to analyze any URL, so you don’t need to own the website.
You can also use the Google Search Console, formerly known as Google Webmaster Central and then Google Webmaster Tools. In order to use Google Search Console, you must be able to prove that you own the website, but once your account is set up you can easily identify common issues that repeat throughout your website. Search Console will show you that can be fixed to improve your score for hundreds of pages on your site.
Key terms
One of the key challenges to understanding Core Web Vitals is that there is some new terminology. Here are five important terms to help you better navigate your Core Web Vitals.
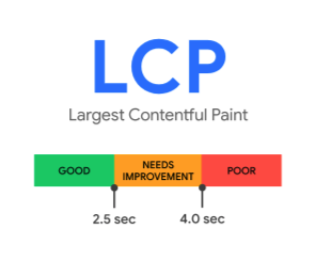
Largest Contentful Paint (LCP) is the metric you are probably most familiar with. When analyzing the performance of your site, one of the key things Google will look at is LCP. It’s a metric that reflects how fast the initial screen of a webpage loads.
The LCP metric reports the render time of the largest image or text block visible within the viewport. The viewport is the user’s visible area of a webpage, also sometimes referred to as the area “above the fold.” This viewport varies on what device the user is viewing the site with. To provide a good user experience, LCP should occur within 2.5 seconds of when the page starts loading.
One of Google’s studies found that mobile web users didn’t tend to keep their attention on the screen for more than 8 seconds at a time. This would mean that if they avert their attention before your page has loaded, the time they’re looking away further delays how soon they finally see the page, so a five-second load time can turn into a 10-second effective delay.
Interestingly, it’s been suggested that the speed of a system’s response should be comparable to the delays humans experience when they interact with one another. This has led to guidance that responses should take between one and four seconds.

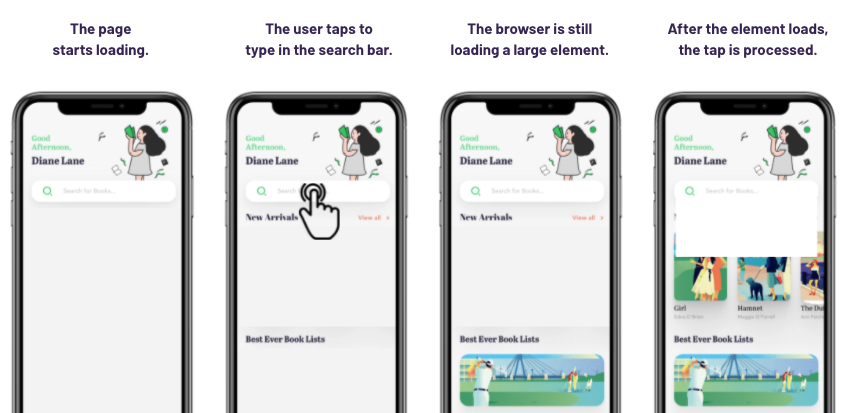
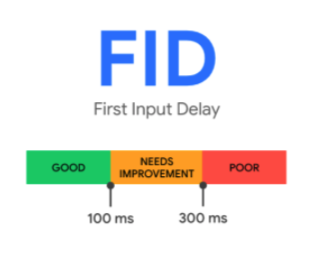
First Input Delay (FID) is the delay between when a user clicks or taps on a page element, such as a link or a button, and the time that the browser is ready to respond to your action and start processing it. To provide a good user experience, pages should have an FID of less than 100 milliseconds. This metric can be a little harder to understand, so here’s an illustration.

FID is like measuring the time from ringing someone’s doorbell to them answering the door. If it takes a long time, there could be many reasons. For example, maybe the person is far away from the door or maybe they need to finish something before answering. Similarly, webpages may be busy doing other work or the user’s device may be slow. In the example above, the FID is the time from the first screen when the page begins to load, to the last frame, where the browser responds to the user’s action and starts processing it, so we see a page starting to load, because we see a search bar, we tap. FID measures how long before your menu, buttons, and forms are ready to respond to user action.

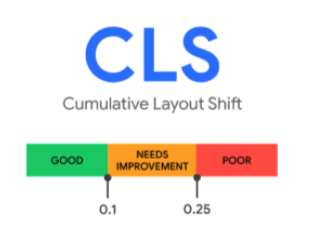
Cumulative Layout Shift (CLS) measures visual stability, for example, where elements on a page jump around as it loads. The negative effects of multiple layout shifts span from mild annoyance to accidental form completions. This can result in bad reviews for the organization and discourage users from returning to the site. A CLS score can be as low as zero for fully static pages and get higher the more layout shifts occur on the page. The lower your score, the more stable your layout is. To provide a good user experience, pages should maintain a CLS of 0.1 or less.

Field Data reflects the browsing experience of real users who used your website in the past 28 days. It is affected by the connection and device they’re using while browsing. When determining your site’s page experience and its positive or negative impact on search rankings, Google will be using Field Data.
Lab Data is based on a simulated load of a page on a single device and a fixed set of network conditions. As of May 2021, Google simulates a Moto G4 with a fast 3G connection. Because field data looks at the past 28-days, there is a lag between making a change and seeing it’s impact. Lab Data is useful because after making a change you can immediately get an idea of it’s impact.
With the updates rolling out this summer, we hope defining these terms helps you and your team have a better understanding of what Google will be looking at as the Core Web Vitals start taking effect. In our next blog post, we’ll be sharing six common issues Google is identifying for websites through the Core Web Vitals update.

