Blog Insights
Data Storytelling: How to Strike the Right Balance
In a world of data, how can you find the meaning behind the metrics? By leveraging the power of storytelling, mission-driven organizations can combine numbers with narrative to communicate impact and drive their audiences to action.
We recognize the power that using narrative has to bring data to life. Forum One works with nonprofits, foundations, associations, and government agencies to understand the meaning behind their data, develop data stories, and build interactive tools to communicate impact effectively. A key element to how we approach meaning through data is to understand the importance of striking a balance. Here are three types of balance that are important for effective data storytelling.
Also → to learn more about the power of data storytelling, download our How-to Guide to Communicating Data for Impact.
 Forum One worked with the Department of Population Health at NYU School of Medicine to create the City Health Dashboard, a resource to guide local solutions that create healthier and more equitable communities. We developed responsive, sophisticated data visualizations that allow users to explore and compare detailed data from multiple sources on health and the factors that shape health. While data from one source by itself may be compelling for illuminating one specific talking point, data incorporating multiple factors provide value for users looking to use more comprehensive measures of health to comprehensive, holistic datasets representing a to drive decisions in a community.
 Forum One’s work with the Georgetown Institute for Women’s Peace and Security (GIWPS) illustrates the balance between combining quantitative and qualitative data to make information accessible and compelling across a wider audience. The GIWPS Women, Peace, and Security Index aggregates data from multiple sources and ranks 153 countries on key, comprehensive measures of women’s wellbeing, inclusion, and justice to highlight achievements and areas of concern around the world. Forum One partnered with GIWPS to design and develop a refreshed website, where users can explore the WPS Index by filtering data by country with an interactive map, comparing data across dimensions and measures, and reading personal stories and profiles behind the data.
 The National Assessment of Educational Progress (NAEP), a program within the U.S. Department of Education, is the preeminent nationwide source for data on education outcomes. The results of NAEP assessments are released as the Nation’s Report Card. Since 2012, our team has worked with Educational Testing Service (ETS) to design and build interactive reports to engage with NAEP results at the national, state, and district levels. To present a clear and concise presentation of the main stories and notable trends, we introduced the “Highlights” product alongside the release of the data. The Highlights pages are built for finding stories, and the combination of narrative and visually compelling graphics shows the important balance between text and visual elements when telling a data-driven story.
In telling a clear and cohesive story, simple can be best. You are trying to convey a specific idea, so pick the relevant data and accompanying narrative that clearly supports this message to your audience. And remember that data storytelling is an ongoing process. As you collect and synthesize more data, continue to find the meaning behind the metrics to advance your organization’s efforts and drive impact.
The National Assessment of Educational Progress (NAEP), a program within the U.S. Department of Education, is the preeminent nationwide source for data on education outcomes. The results of NAEP assessments are released as the Nation’s Report Card. Since 2012, our team has worked with Educational Testing Service (ETS) to design and build interactive reports to engage with NAEP results at the national, state, and district levels. To present a clear and concise presentation of the main stories and notable trends, we introduced the “Highlights” product alongside the release of the data. The Highlights pages are built for finding stories, and the combination of narrative and visually compelling graphics shows the important balance between text and visual elements when telling a data-driven story.
In telling a clear and cohesive story, simple can be best. You are trying to convey a specific idea, so pick the relevant data and accompanying narrative that clearly supports this message to your audience. And remember that data storytelling is an ongoing process. As you collect and synthesize more data, continue to find the meaning behind the metrics to advance your organization’s efforts and drive impact.
Balance the use of individual and collective stories
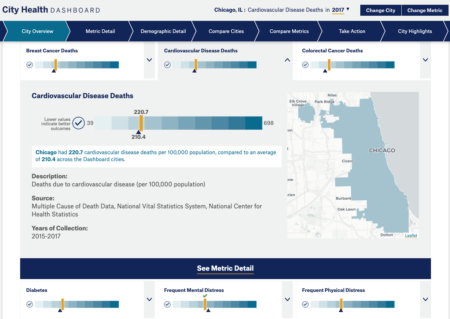
When identifying the best data for the story, it is important to think about the value of an individual story versus aggregate data. An individual person’s story can be compelling on an emotional level in a way that pure data cannot. An aggregate measure, on the other hand, offers objective facts that are more removed from the tangible experience of one specific data point. Think about the power of using one versus the other, or the value of using both, given the story’s context and what message you want to convey to your audience.Case in point: NYU’s City Health Dashboard
Forum One worked with the Department of Population Health at NYU School of Medicine to create the City Health Dashboard, a resource to guide local solutions that create healthier and more equitable communities. We developed responsive, sophisticated data visualizations that allow users to explore and compare detailed data from multiple sources on health and the factors that shape health. While data from one source by itself may be compelling for illuminating one specific talking point, data incorporating multiple factors provide value for users looking to use more comprehensive measures of health to comprehensive, holistic datasets representing a to drive decisions in a community.
Balance quantitative and qualitative data points
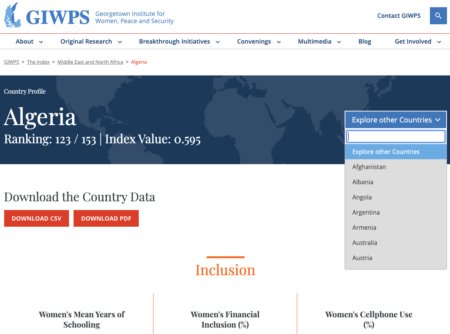
Balancing numerical data with non-numerical data is key for a cohesive narrative. Many mission-driven organizations rely on statistics to drive fundraising campaigns and marketing efforts. To strengthen these efforts, supplement this hard data with qualitative data that capture human behavior, observations, and experiences. Making the numbers more relatable by providing human context makes for a more compelling narrative and greater success in audience engagement.Case in point: The Georgetown Institute for Women’s Peace and Security
Forum One’s work with the Georgetown Institute for Women’s Peace and Security (GIWPS) illustrates the balance between combining quantitative and qualitative data to make information accessible and compelling across a wider audience. The GIWPS Women, Peace, and Security Index aggregates data from multiple sources and ranks 153 countries on key, comprehensive measures of women’s wellbeing, inclusion, and justice to highlight achievements and areas of concern around the world. Forum One partnered with GIWPS to design and develop a refreshed website, where users can explore the WPS Index by filtering data by country with an interactive map, comparing data across dimensions and measures, and reading personal stories and profiles behind the data.
Balance text and visual elements
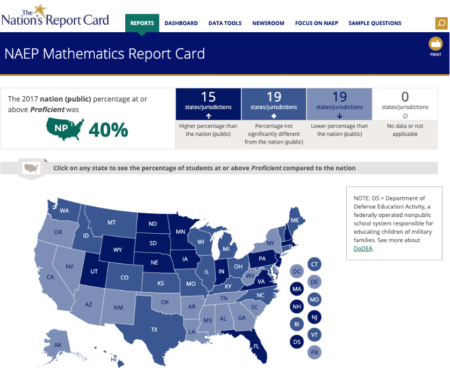
A strong story balances numbers and narrative. Data visualizations and infographics help the audience understand the context and can be eye-catching and easy to share; however, without strong supporting text, the message doesn’t encompass the human experiences represented by those data points. Striking the right balance between text and visual elements is what makes for an impactful story: one that is both credible and compelling.Case in point: The Nation’s Report Card
The National Assessment of Educational Progress (NAEP), a program within the U.S. Department of Education, is the preeminent nationwide source for data on education outcomes. The results of NAEP assessments are released as the Nation’s Report Card. Since 2012, our team has worked with Educational Testing Service (ETS) to design and build interactive reports to engage with NAEP results at the national, state, and district levels. To present a clear and concise presentation of the main stories and notable trends, we introduced the “Highlights” product alongside the release of the data. The Highlights pages are built for finding stories, and the combination of narrative and visually compelling graphics shows the important balance between text and visual elements when telling a data-driven story.
In telling a clear and cohesive story, simple can be best. You are trying to convey a specific idea, so pick the relevant data and accompanying narrative that clearly supports this message to your audience. And remember that data storytelling is an ongoing process. As you collect and synthesize more data, continue to find the meaning behind the metrics to advance your organization’s efforts and drive impact.