Blog Insights
The Service Flow-Print: A Proposed Artifact for Complex Service Designs
This post is an adaptation of a pecha kucha talk Tim Shaw gave to the DC chapter of the Service Design Network for its celebration of Service Design Day. You can watch a recording of Tim’s talk here.
We recently came across an issue distilling and combining research for a project where we would typically use a service blueprint approach. Our team used a bit of problem-solving and created a new artifact that visualizes complex service designs.
The problem: a great tool that doesn’t always work
When we began exploring experience design variations emerging in the service design space a few years ago, one tool particularly attracted our attention: the service blueprint. We posted an introduction to these artifacts last year. A service blueprint can concisely diagram all the facets involved in providing a service to end customers. Here’s an example:
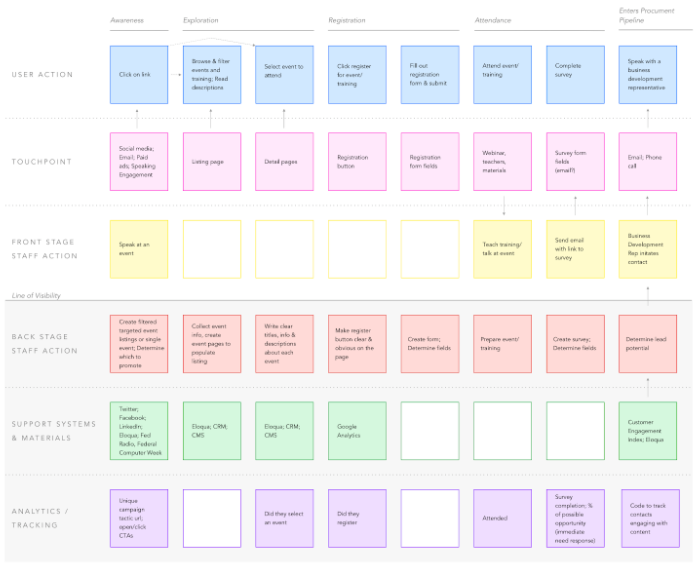
Each column is a step in the service delivery process, but what is unique and powerful is the rows, or “swimlanes,” which show clearly that providing the service involves people, systems, and processes, all working together. They also emphasize that, while there are key customer-facing activities happening on the “front stage,” the service can’t happen without actions happening behind the scenes on the “back stage.” Thinking about all these elements is critical as one considers the design of an experience.
We began creating a service blueprint for the US Department of Health & Human Services’ Office of Head Start (OHS). We had completed an array of research activities to understand one of OHS’s key services and we needed to pull together our findings for review and subsequent design work. A service blueprint seemed a great fit. This is where, however, we ran into a problem.
If you study the example above, it might strike you that the service blueprint has a major weakness: it is purely linear. It relies on the underlying service process to be a smooth ‘first A, then B, then C’ flow with no consequential forks or decision points. The service we were documenting for OHS didn’t look at all like that. We were trying to document important alternate paths and inconsistently used flows. A service blueprint just wouldn’t work.
The solution: a marriage of artifacts
The classic way to document complex complex processes is the flow chart. These tools can show divergent and alternate paths and their various outcomes. They don’t, however, include all the valuable information in the swim lanes of a service blueprint. What was needed, I realized, is to marry the depth of a service blueprint onto the process layout of a flow diagram. This is how we created the “service flow-print.”
The flow-print has, at its core, a simplified flow chart. We use standard symbols for initiations and endings, steps, and decision points. Here’s an outline of how one begins:
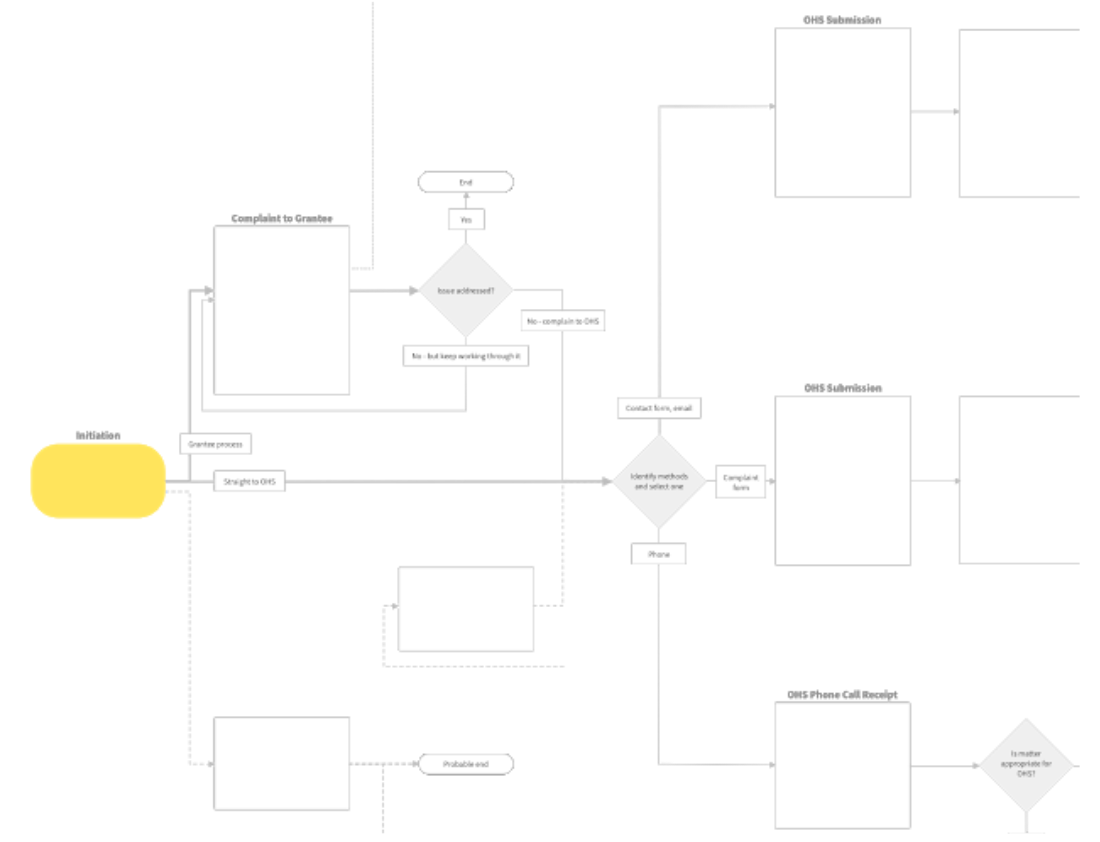
The difference is that we add more information to the boxes for each step instead of using brief labels.
Remember the swimlanes from the service blueprint? The service flow-print integrates them into each step of the process, as is appropriate. Here an example of the process filled in with descriptions and swimlanes:
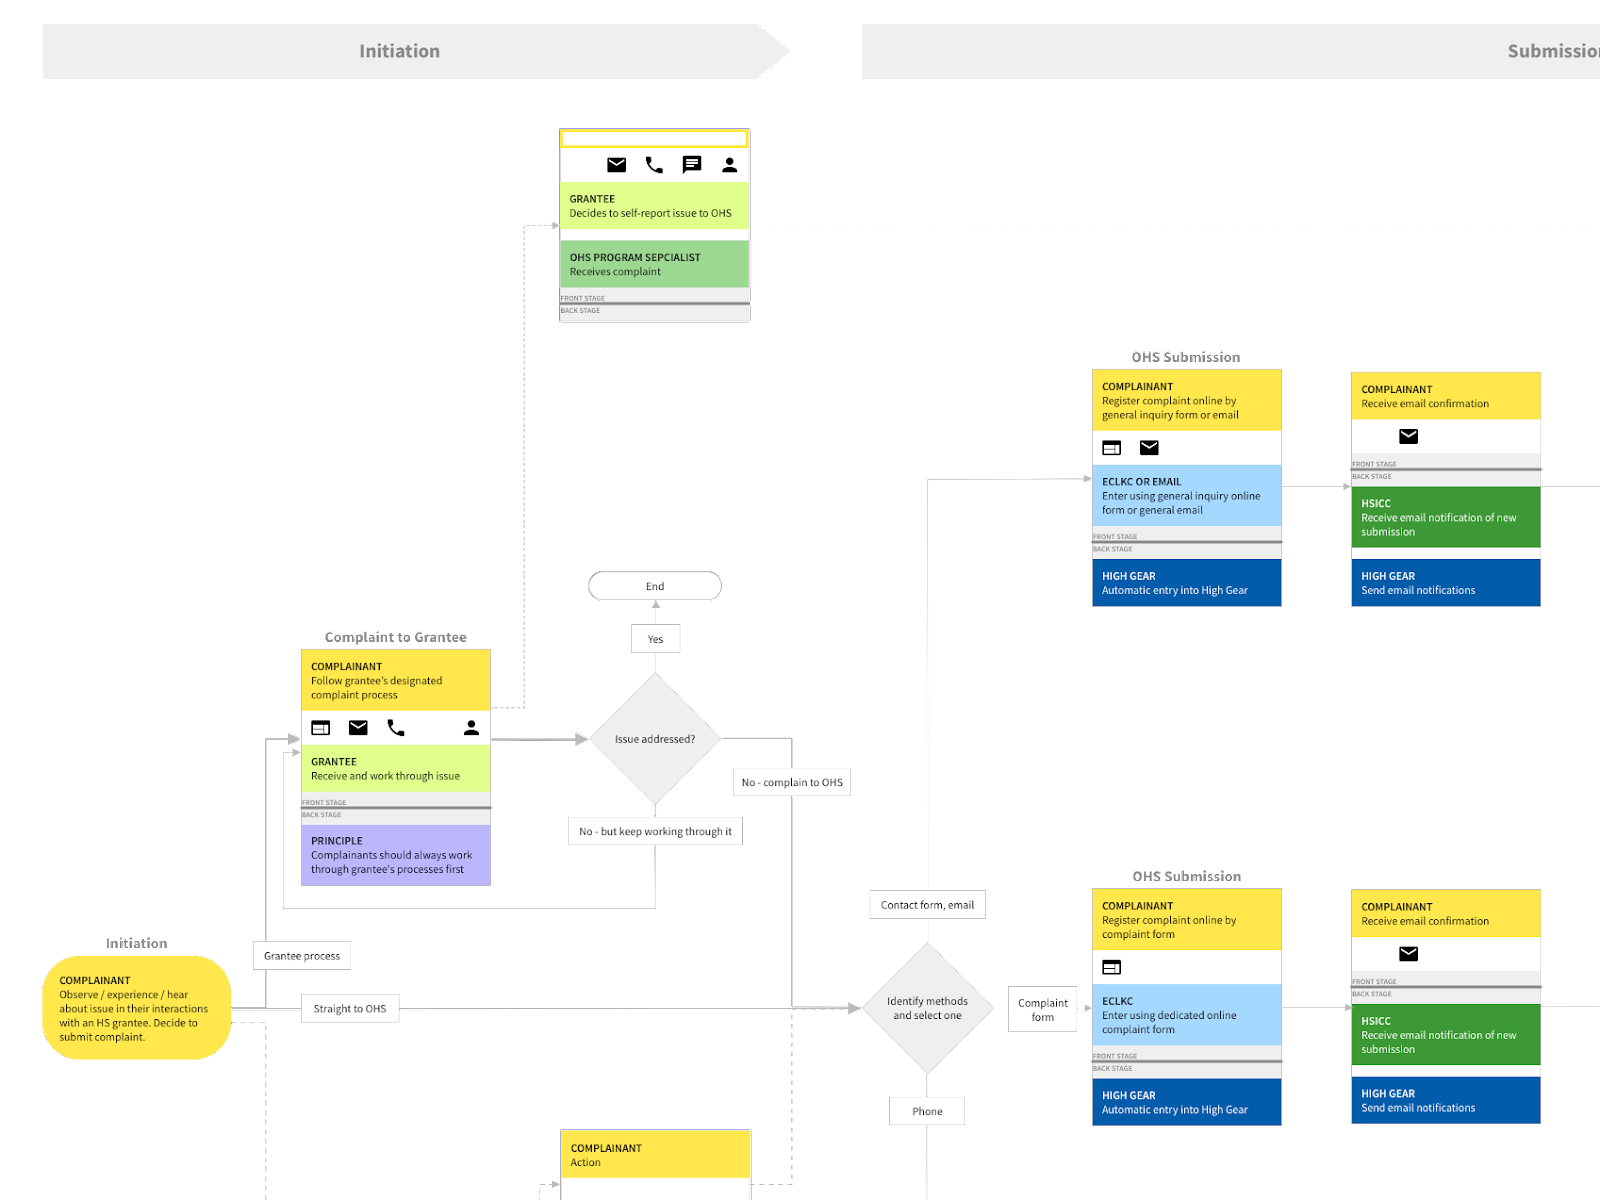
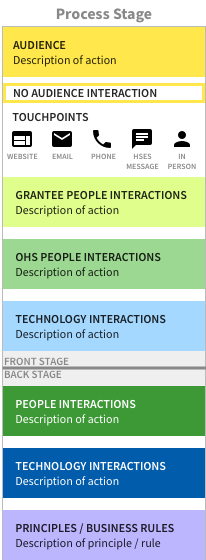
Each color represents a different swimlane, and the order and structure is fixed:
There are some deliberate, important choices we made in designing this tool:
- The audience, represented by yellow, appears in every box. We do this even when it is only an empty, yellow-outlined box to indicate there is no audience interaction in that step. We were looking for continuity and a clear reminder of when the audience is and is not involved. It may be entirely appropriate for audiences not to be involved in a step, but I wanted to provoke deliberate thought on this point.
- On a traditional service blueprint the line that separates the audience-facing front-stage and the not-facing back stage (the “line of visibility”) is a clear marker that runs across the document horizontally. In the flow-print diagram, this doesn’t work. We retain this line, though, by placing an indicator in each and every box, even for cases where there are only front stage or only back stage activities. This creates an anchor to orient the reader and emphasize the two states.
- Our OHS research turned up several general principles or business rules that governed how they operated the service in question. These were important to capture, so we created a separate back-stage swim lane for them, distinct from the people and technology elements.
The diagram alone gives some information, but to make it clear where to focus, we added an additional layer that marks places where the research uncovered issues, inconsistencies, or areas we’d like to know more about.
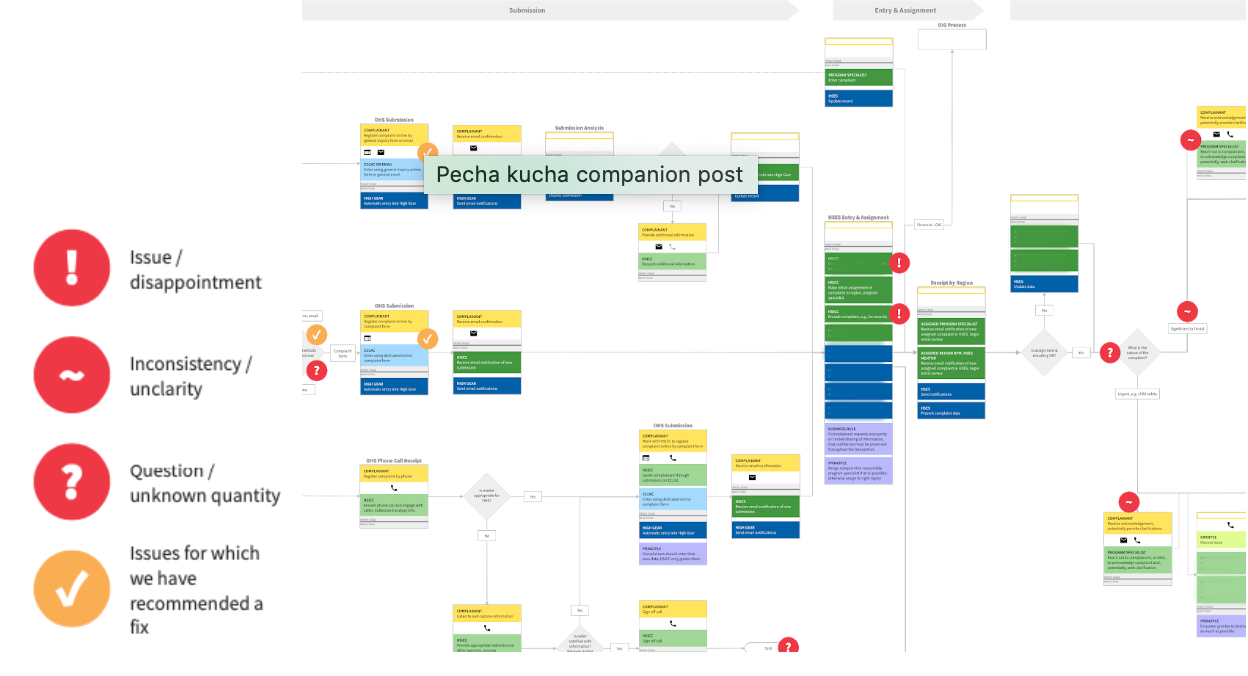
We created a companion slide deck to provide detail on all these points. Here’s where you will want to make sure you capture the source research well so you can point back to it. We didn’t want to attribute comments directly, but we did pair the facts we documented above with quotes, and, in the case of usability tests, videos, to give emotional weight to our points. You have to tell the full story to make the case for subsequent changes.
How will we use this new tool?
We are now using the tool to prioritize the areas on which we need to focus first. Being able to see the whole service and see where dependencies and points of leverage are will be important in this task. We will also be able to identify who needs to be involved—or who needs serious buy-in for change— not only by looking directly at the swimlanes in the immediate steps, but also by looking “downstream” at others who may become involved or interested later.
It is clearly just one tool we’ll need, while direct workshops to generate ideas for solutions will be key, but it will certainly help focus us and move our efforts to improve the performance of this OHS service.