Blog Insights
Create Remarkable DataViz with D3
Many tutorials start off with “how” but there is a huge assumption made that the question of “why” lands 100% accurately to this tool. Before creating a “Data visualization” I assume you have already asked yourself:
- What story do I want to tell with my data?
- Does my data tell that story?
- What visualization best tells my story?
I believe D3 (which stands for “data driven documents”) is a wonderful tool for creating data visualizations and consider it my tool of choice when tasked with a visualization requirement. Between the many coded examples available and the many flavors of D3 based libraries, there is no shortage of resources to get to a great visualization in a relatively small time frame.
D3 is essentially the glue between your data and the elements you create to visualize it. For web-based visualizations, this means creating DOM-based elements that are then manipulated relative to specific data.
One common DOM element that is used is scalable vector graphics (SVG). SVG allows us to create arbitrary shapes that can be manipulated based on our data through D3. It has great browser support. Using SVG syntax, you can create something like this pretty easily which you can easily tell mimics the elements of a really popular way of visualizing data:
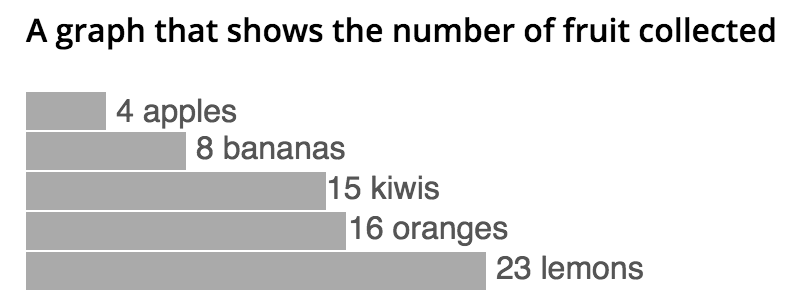
<svg class="chart" width="420" height="150" aria-labelledby="title desc" role="img">
  <title id="title">A bar chart showing information</title>
  <desc id="desc">4 apples; 8 bananas; 15 kiwis; 16 oranges; 23 lemons</desc>
  <g class="bar">
    <rect width="40" height="19"></rect>
    <text x="45" y="9.5" dy=".35em">4 apples</text>
  </g>
  <g class="bar">
    <rect width="80" height="19" y="20"></rect>
    <text x="85" y="28" dy=".35em">8 bananas</text>
  </g>
  <g class="bar">
    <rect width="150" height="19" y="40"></rect>
    <text x="150" y="48" dy=".35em">15 kiwis</text>
  </g>
  <g class="bar">
    <rect width="160" height="19" y="60"></rect>
    <text x="161" y="68" dy=".35em">16 oranges</text>
  </g>
  <g class="bar">
    <rect width="230" height="19" y="80"></rect>
    <text x="235" y="88" dy=".35em">23 lemons</text>
  </g>
</svg>
Note that we haven’t touched D3 yet. That example works great for that data until we want to use dynamic data. Then we’ll need our “rect” elements to have a variable “width” and “y” with respect to that data. This is where D3 comes in.
Using D3, we create this visualization as follows:
var dataset = [
 {"name":"Apples",
  "total":4
 },
 {"name":"Bananas",
  "total":8
 }
];

var vizsvg = d3.select("#viz")
        .append("svg")
        .attr("width", 600)
        .attr("height", 600);

var bars = vizsvg.selectAll("circle")
    .data(dataset)
    .enter()
    .append("g");

bars.append("rect")
    .attr("width", function(d) {
            return d.total * 10;
       })
    .attr("height", 19)
    .attr("y", function(d, i) {
    // i is the current data node index
            return (i * 20);
        })
    .attr("fill","red");

bars.append("text")
    .attr("y", function(d, i) {
            return (i * 20) + 9.5;
       })
    .attr("dy", '.35em')
    .attr("x", function(d, i) {
    // i is the current data node index
            return (i * 45) + 45;
        })
    .attr("fill","red")
    .text(function(d, i) {
  return (d.name);
});
The great things about this is that all these DOM elements can be manipulated as needed using all the tools you know already like JS, CSS, etc. For example, you can theme your “rect” elements using a selector like this:
#viz g rect {
  fill: blue; /* changes bar to blue */
}
This is just scratching the surface with D3. There is a long list of functions that D3 provides that allows you to manipulate your visualization to your needs like scaling, transitions and more.
I hope that was a good intro. Now go ahead and start playing 🙂
Further reading and resources:
- D3 Examples
- D3 Documentation
- How to Make Charts with SVG
- A Data-Driven Tour of the Universe (How Data Viz is Done)
- The Beauty of Data Visualization (David McCandless Ted talk)
- Let My Dataset Change Your Mindset (Hans Rosling Ted talk)